
West End ticket sales snapshot casts light on the state of play
The first rule of West End ticket sales? Do not talk about West End ticket sales. In this industry, that’s just how it is. I was contacted a grand total of three times this year by West End producers about their box office, and it will not shock you to know that none of them were shouting about average or sub-par sales.
They were, of course, all trying to let me know they’d had “record-breaking” sales or that tickets had “sold out” – but hard sales or profit figures are almost without exception non-existent. Sometimes, though not often, producers feel it is newsworthy to share that their show has broken even, which is indicative of how hard it can be to make a profit in the commercial West End.
To combat this wall of silence on actual box office figures, The Stage started its own West End Box Office records in 2014: a weekly snapshot of how 10 shows are doing, by looking at how many tickets were available to buy online just before each show goes on. This is not exhaustive by any stretch of the imagination – there are just over 50 venues in the West End – but it’s a sizeable enough chunk to get a rough idea.
While last year’s figures stood up fairly well against historical data, this year’s West End Box Office counts show a divergent pattern. Usually we would expect sales figures that fluctuate throughout the year, with intermittent peaks in January, February, October and over the summer. But this year the number of tickets left unsold steadily increased as the year went on, before a small fall in August and a major spike in empty seats across September.
Comparing this year’s West End Box Office data with last year’s, the West End seems to have had a better year in 2016. While unsold seats remained at similar levels during peak months August and October, Theatreleand appeared to fare considerably better in the first half of 2016 than over the same period in 2015.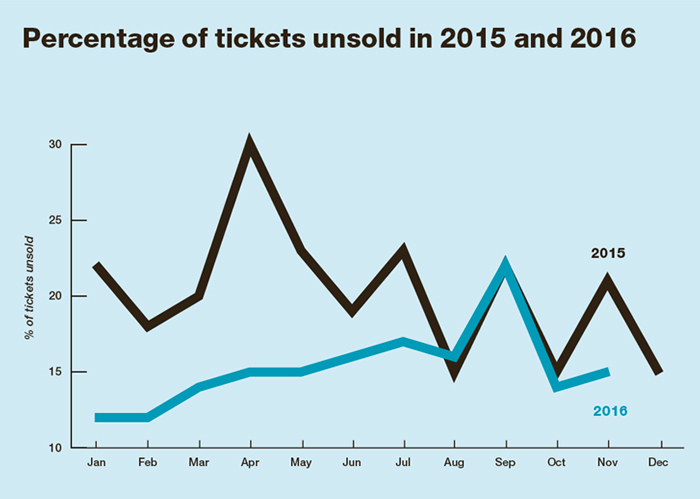
The count has only been running for only two full years, but significant discrepancies between the data throw up some questions as to its veracity. Though it would be highly unusual for attendance to vary that widely year on year, it is not unheard of. According to Society of London Theatre figures, January audiences were just over 400,000 in 2014, but only around 280,000 in 2015. Sometimes, the numbers are surprising. Alternatively, the results could be skewed by the particular shows that were counted, or by producers gaming the system by keeping some seats off sale.
As last year, the day with the fewest tickets remaining available to buy was in January. Apparently high audience attendance (only 7% left unsold across our 10 shows) was bolstered by two sell-out plays – War Horse and Hangmen – as well as strong showings from The Lion King, Matilda, The Phantom of the Opera, The Curious Incident of the Dog in the Night-Time and The Homecoming. For all these shows, 5% or less of tickets remained unsold.
This year the West End appeared to perform worst on September 20, with a quarter of all seats still available to buy just before the monitored shows went on. September is traditionally a weaker month for the West End, and continued to be so in 2016 – with 22% of seats remaining empty across the month. For five shows – Sunny Afternoon, Curious Incident, The Woman in Black, 1984 and The Mousetrap – between a third and a half of their seats were empty. Though that might sound gloomy, these snapshot findings look positively rosy compared with April 2015, in which nearly a third of tickets were left unsold on average across shows.
As we try to get an overview of as many shows as possible, we can’t do long-term tracking for every show in the West End. However, some plays and musicals have been monitored more than others.
Curious Incident, for example, was monitored in nine out of our eleven counts so far. With some degree of consistency, 20-25% of its tickets have remained unsold – not great for a play with a capacity of 934. The show has now announced it will close next year to make way for a West End transfer of Royal Court show The Ferryman – though not terminal, those figures mean its closure does not come as a huge surprise.
Though our data is not exhaustive, it can provide useful insights. Guys and Dolls, for example, was performing poorly in our count in June and July (22% and 33% unsold), long before it was announced the show would close four months earlier than planned. It did, however, perform better in its final month, when a last-minute flurry of interest before closing may have contributed to higher ticket sales.
In the past, weaker months in our count have been held buoyant by one or two sell-out shows, but there have been markedly fewer of those this year. One exception was War Horse, which bowed out of the West End with two of its best ever showings in our count: only 2% unsold in January and a total sell-out in February. A surge in publicity around the show’s closure clearly had the desired effect.
It is interesting, though perhaps not surprising, that musicals performed consistently better than plays in our count – an annual average of 10.7% unsold and 21.6% respectively. In fact, plays only came close to outperforming musicals in May, which was both the worst month for musicals and the best month for plays. The reasons for this are unclear.
Despite musicals attracting greater audiences, plays’ performance tends to tally more closely with the overall health of the West End. Data for plays correlates much better with the overall data than that for musicals, and the high point and low point for plays (13.6% and 32% unsold) matches the best and worst months in our count, January and September. The same is not true of musicals.
Of course, our count does not cover the whole West End. We cannot, for example, include shows at Nimax venues, as we can only count shows with seat selection as part of the ticketing process; Nimax does not currently offer this service. This means we miss out on some shows that are potentially struggling, as well as major hits. We can say with near certainty, for example, that Harry Potter and the Cursed Child at the Palace Theatre has been a sell-out every week since it opened in July. But it won’t appear in our count, nor affect our overall figures.
At the time of publication, our data for December is incomplete, and is therefore not included in this round-up. However, both last year’s West End Box Office data and figures from SOLT indicate that December is likely to join January and October as significantly good months for West End ticket sales.
So, while our data is not perfect, it is not without merit. It provides insights that would otherwise be unobtainable for anyone who is not an investor in a West End production. Perhaps we are nearing a time when producers are confident enough to be more open about how their shows are doing, whether they are successes, failures, or just trot steadily on – a success by West End standards. But until then, we will continue to count.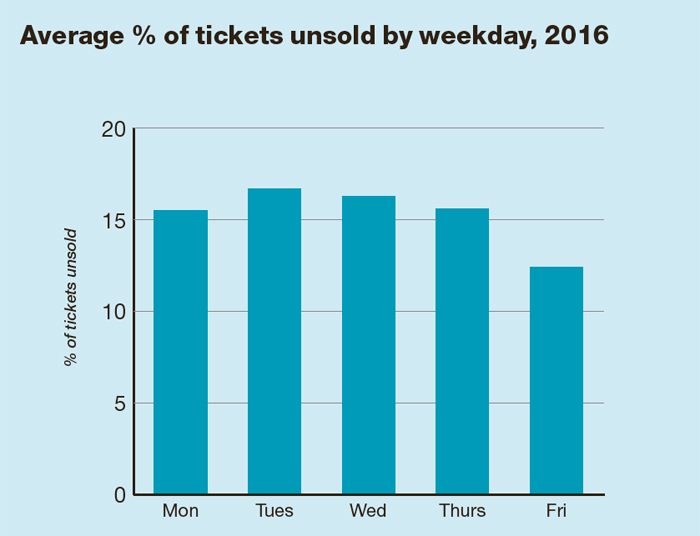
West End box office in statistics
• Best-performing day of the week: Friday
• Worst-performing day of the week: Tuesday
• Most popular date counted in 2016: Friday, January 8
• Least popular date counted in 2016: Tuesday, September 20
• Total Number of shows counted: 26
• Best-performing month: January
• Worst-performing month: September
Methodology
We monitor the shows on a different day week-on-week, and count unsold tickets for the evening performance on the same day. The selection of shows changes each month, but is never entirely different.
Our analysis does not include tickets sold between our count and the evening performance or through third-party vendors. This is why we place emphasis on the number of tickets that remain unsold.
However, we do the count when most third-party tickets have been returned to the theatre. The results should be treated as indicative of performance rather than as a precise record of the number of seats unsold.
During 2016, West End Box Office was compiled by David Hutchison and Georgia Snow


Opinion


Recommended for you


Opinion
Recommended for you
Most Read
Across The Stage this weekYour subscription helps ensure our journalism can continue
Invest in The Stage today with a subscription starting at just £7.99

© Copyright The Stage Media Company Limited 2025